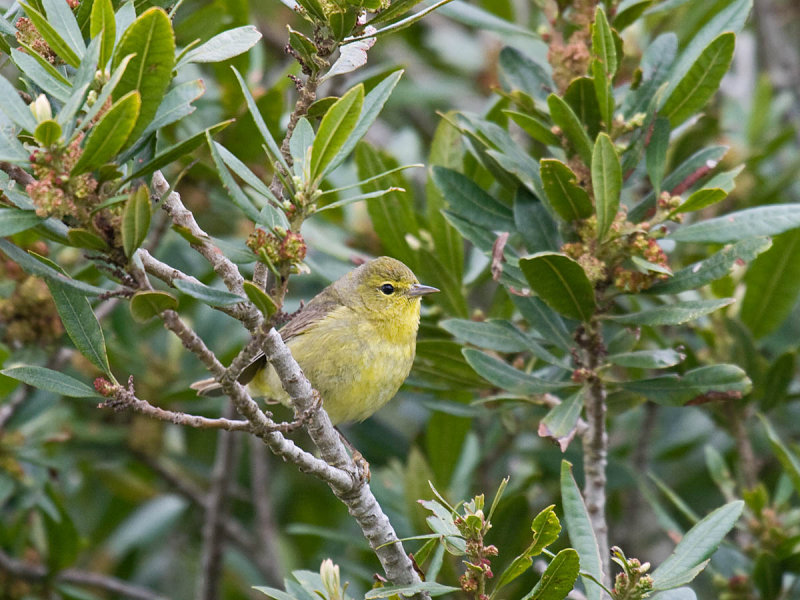
 Orange-crowned Warbler, Newport, Oregon on 30 April 2010 by Greg Gillson.
One of the "games" that birders play is to be the first one locally to see a certain migrant. Birding listservs in spring are often titled: "FOS: ..." for First Of Season.
It is a joy to once again meet up with your bird "friend" in April or May that you may not have seen since last September. Migration is an amazing natural wonder.
However, some individual birds of many of our migrant species, may winter locally. Or, maybe there is one adventurous bird migrating early. Averaging the first arrival date over several years gives a good idea of when the first individuals of a certain species might be expected. But eBird allows us to examine migration in so much more depth.
As we discussed previously (What is eBird?), eBird is a free web-based software tool that allows you to record your bird sightings. With it you can track your personal birding lists. However, its power comes from combining your list with thousands of other birders' lists.
What follows is a detailed explanation of how to use eBird to track migration near you. I want you to be able to do this yourself....
So, the first thing I do is select a location of interest. Since I live in the Willamette Valley bio-region of western Oregon, that's where I start.
eBird.org: View and Explore Data is the tab to choose. I select the abundance Bar Charts. Then I choose my location. Oregon is the state, but now I choose Counties in Oregon and hit Continue.
eBird allows you to combine up to 14 counties at once. That is usually enough to define a smaller region among Oregon's 36 counties. I will choose the 9 counties of the Willamette Valley. In this case I am leaving off the southernmost, Lane County, as it includes part of the coast. Many birds arrive on the coast first, before the inland valleys. Not a perfect solution, but it will do.
Now eBird builds a complete checklist of all sightings ever reported in the area I specified. eBird then creates an abundance bar chart for each "week" of the year (each month is divided into 4 weeks, so some weeks have 7, 8, or 9 days).
Now I scroll down and select Orange-crowned Warbler (right-clicking on my Windows PC mouse and opening in a new tab, so I don't "lose" the entire bar chart and have to hit the "back" button and reload it all).
When the Orange-crowned Warbler page opens, it again shows the bar chart for this species. You can choose any time-frame, in one-month intervals. Below this is a map with all sightings mapped with "push pins." Click on each pin to see the location, date, number of individuals counted, and the name of the observer.
At this time, however, choose the Frequency tab. This will tell you how many (%) of all checklists in your defined area that week reported the species. This tells you how widespread the species was in your area.
Below is the frequency of Orange-crowned Warbler sightings in the Willamette Valley for the years 2007-2010 (right-click and open in new window for a larger view).

By examining the screen shot above, you can see that there are some individual Orange-crowned Warblers found in winter in the Willamette Valley. You can't really be sure if the one bird you see is the "first" detected migrant or not. However, beginning with the 4th week of March (week starting 3/22), Orange-crowned Warbler sightings jump! By the first week of May they are the most widespread, being found on 30% of all checklists reported anywhere in the counties containing the Willamette Valley.
Orange-crowned Warblers then move to the hills to breed, so they aren't quite as widespread during the summer. But in September, they start migrating south and are found in more areas, peaking (being most widespread) the 3rd week of September (week beginning 9/15). By the middle of October, Orange-crowned Warblers are mostly gone.
But now select Totals and see, not how widespread, but how numerous they are throughout the year (screen shot below, right-click and open in new window for a larger view).

Looking at this data, we see that Orange-crowned Warblers are most numerous the 4th week of April (week starting 4/22). And though the Frequency charts showed they were fairly widespread in late September, this Totals chart shows they are not numerically very common then.
How does this compare to what is written in Handbook of Oregon Birds, 2009 by Herlyn and Contreras? Well, they say: "Spring migration begins in mid-Mar along the s. Ore. coast and peaks in Apr.... Fall migrants peak in early to mid-Sep, and most are gone by mid-Oct."
Also listed are compilations of average first-arrival dates: March 21 for Benton County, and March 19 for Portland area.
So, eBird data refines the area and quantifies the general Oregon status given in this great little book.
Some of the other tabs, showing the data in other ways, may prove interesting to you. They will be more accurate as the database grows. Since eBird usage seems to be growing about 25% per year in Oregon, the information gleaned is getting more and more accurate--and interesting.
There it is, then--Orange-crowned Warbler migration in the Willamette Valley charted and graphed. We didn't look at the other tabs. I leave that as an exercise for you.
I am sure you can think of a migrant bird in your area that you would like to graph out this same way.
View all posts with the label: "eBird"